Somebody asks "is 3% a good conversion rate?" and the honest answer is another question: compared to what? Compared to whose study, measuring which industry, over what time period, counting which visitors as "real" traffic?
That's not a dodge. It's the actual problem with landing page benchmarks in 2026 — there are more of them than ever, and they don't agree with each other, sometimes by a factor of three.
Why the "Average" Keeps Changing
Unbounce studied 41,000 landing pages and 464 million visitors and landed on a median of 6.6%. WordStream, pulling from a different and broader cross-industry dataset, puts the median at 2.35%, with the top 25% of pages hitting 5.31% or better and the top 10% clearing 11.45%. Other 2026 sources split the difference and cite 4.3% as the all-industry median.
Three real numbers. Three real methodologies. None of them wrong, exactly — just measuring different populations of pages, in different industries, with different definitions of "conversion." A newsletter signup and a $3,000 service inquiry are not the same action, and lumping them into one "average" is where most of the confusion starts.
What the Range Actually Looks Like, by Industry
The industry-specific numbers are more useful than any single blended average:
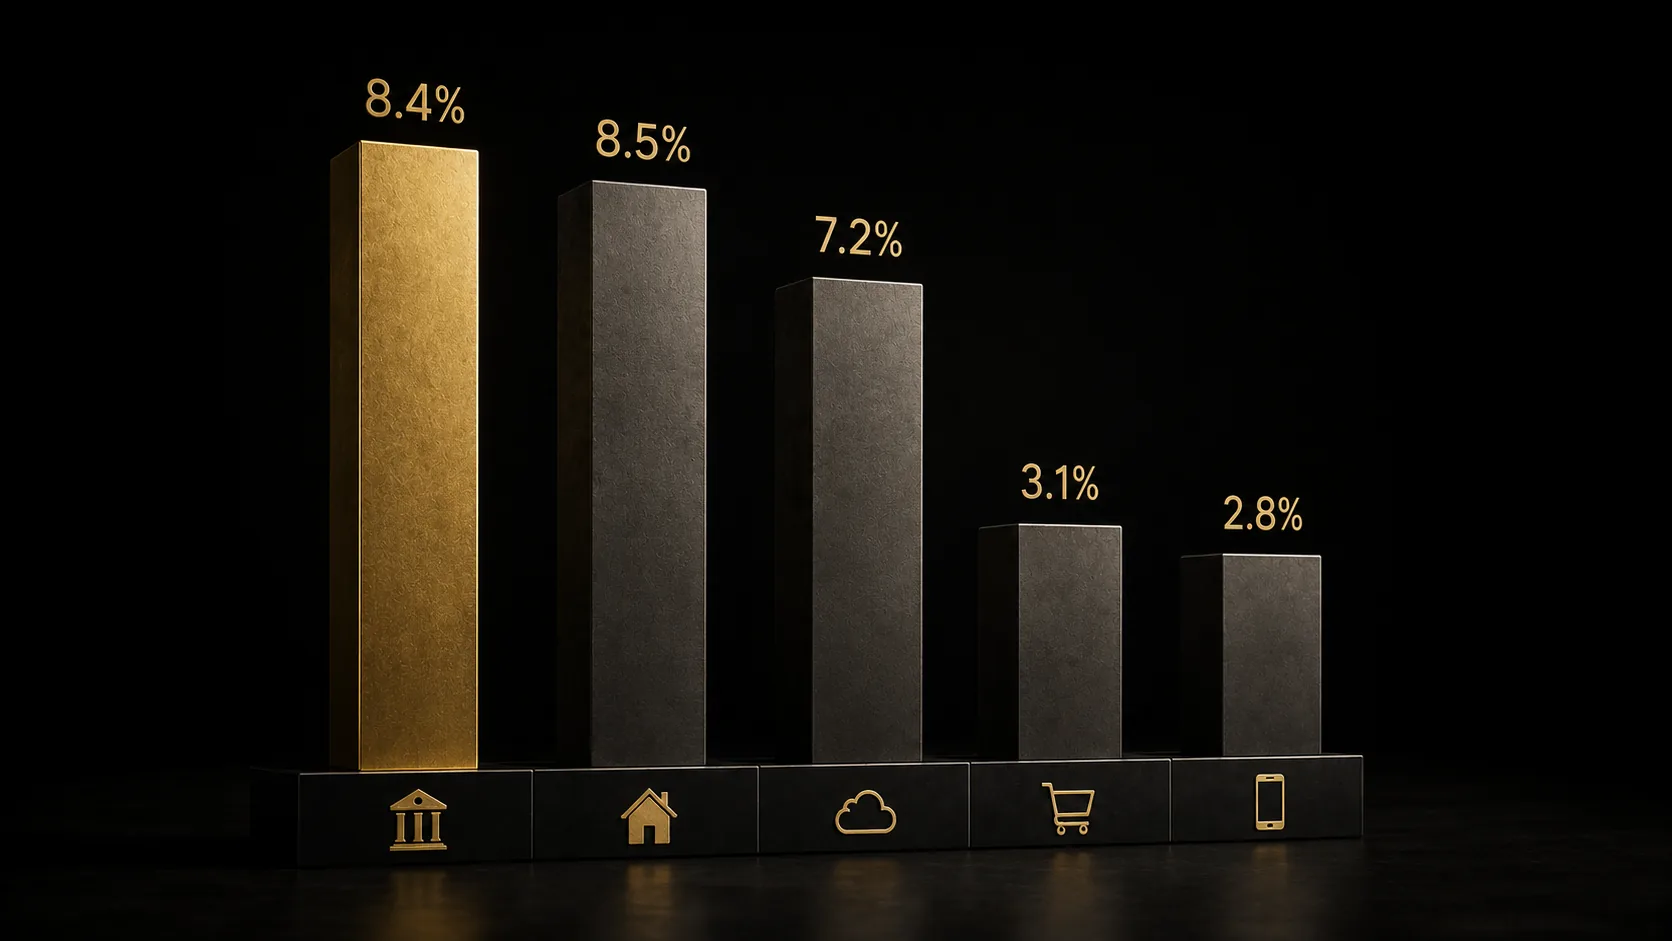
- Financial services: 8.4% median — the highest of any category found
- Home services lead gen: 8.5%
- SaaS free trials: 7.2%
- Ecommerce: 3.1%
The gap between the top and bottom of that list is almost 3x. If you're running an ecommerce store and benchmarking yourself against a SaaS free-trial page, you'll spend a lot of energy feeling bad about a number that was never comparable to begin with.
The Device Gap Nobody Adjusts For
Mobile pages convert at roughly 2.8% against desktop's 4.8% — a gap that's rarely broken out separately when a business reports "our conversion rate is X%." If most of your traffic is mobile (and in 2026, it usually is), your blended number is quietly being dragged down by a device your desktop-era benchmark never accounted for.
Two things move the needle regardless of industry or device: video on the page lifts conversion by roughly 86%, and personalized CTAs convert 202% better than generic ones. Neither requires a redesign. Both are usually cheaper to add than a benchmark obsession is to cure.
The Number That Actually Matters
Here's the uncomfortable part: none of the numbers above tell you anything about your page. They tell you about a dataset you're not in.
The number worth tracking is your own baseline — what your page converts at right now, this month, with this traffic — compared to what it converts at after a specific, documented change. Not the industry median from a study you'll never fully match, sampled from businesses you've never heard of, selling things you don't sell.
Benchmarks are useful for exactly one thing: telling you whether it's worth the effort to look closer. If you're at 1% in an industry where 8% is normal, that's a real signal. If you're at 3% and comparing yourself to a 6.6% blended average pulled from 41,000 unrelated pages, you might be doing better than you think — and chasing a number that was never yours to hit.
Before assuming your page has a problem, it's worth knowing what it's actually doing, on its own terms, against its own history. That's a smaller, less dramatic question than "are we good or bad" — and it's the one that actually leads somewhere.